
Results of the 2011 Origin Destination (OD) Survey
Planning tomorrow's transportation today!

The Société de transport de l’Outaouais (STO) is a partner in the 2011 Origin Destination (OD) Survey. The survey, which is conducted every five years, shows the changes in transportation habits within the greater National Capital Region. The resulting data are valuable because they are a source of accurate information for strategic transportation planning, in particular public transit.
The survey ran from September 2011 to November 2011, with more than 25,000 telephone interviews carried out with households in Ottawa, Gatineau and MRC des Collines-de-l’Outaouais. The 2011 survey includes people age 5 and over.
Reassuring findings!
A 9% increase in transit use since 2005 in the National Capital Region.
The upward trend observed in the use of public and active modes of transportation in the National Capital Region is encouraging. The survey also indicates that bus use in the STO service area has jumped 17%. We must continue our efforts in this direction, and the launch of Rapibus this year will enable us to rally even more people to use public transit with the new corridor reserved exclusively for buses. Cyclists will also have a place, as a bike path will be added.
STO Chairman Patrice Martin
Mobility in the STO service area
Main findings of the 2011 survey
- Increase in transit modal share.
The number of daily trips completed by bus from among all daily trips made by all modes rose from 10.8% in 2005 (or 71,700 trips by bus out of 661,500 trips made by all modes) to 11.5% in 2011 (or 83,600 trips by bus out of 725,200 trips made by all modes).
- Between 2005 and 2011, the STO’s ridership rose by 17% while the population grew by 8%.
- The large majority of transit trips in the Outaouais occur during peak periods.
Daily distribution of transit trips in the STO service area
Period | Percentage of daily trips |
|---|---|
AM peak | 35 % |
PM peak | 33 % |
Off peak | 32 % |
68% of transit trips in the STO area occur during 5 operating hours per day. | |
32% of transit trips in the STO area occur during 14 operating hours per day. | |
Transit modal share in the STO area
AM peak period (6:30 to 9:00)
Trips | 2005 | 2011 |
|---|---|---|
| 26 % | 32 % |
Destined to the area | 21 % | 22 % |
Internal | 12 % | 10 % |
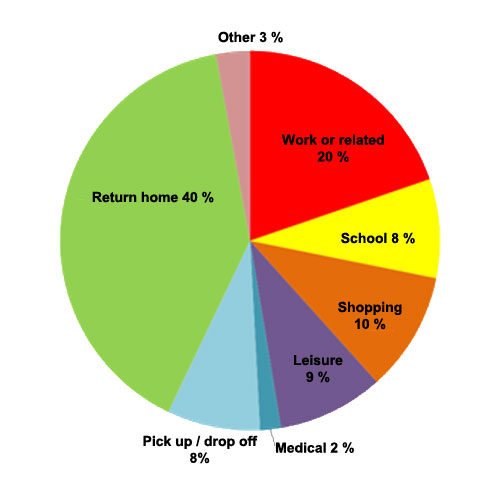
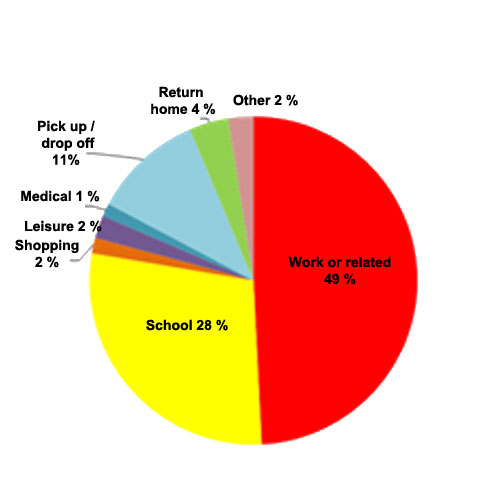
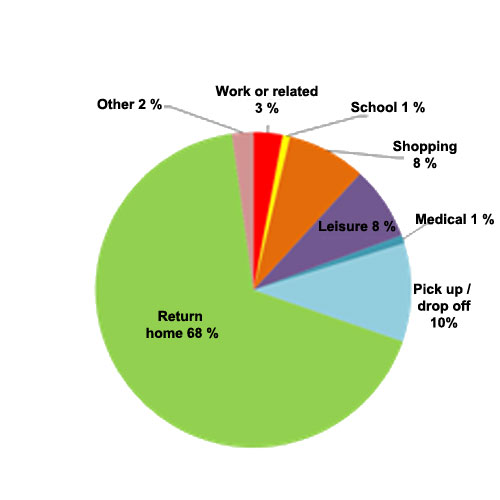
Trips by trip purpose
STO area (age 5+)
24 hours
AM peak period
PM peak period
For more information
For more details about the survey results on travel habits within the greater National Capital Region, visit www.O-Dsurvey.ca.