
Satisfaction Survey about STO Services (2019)
Carried out in 2019, the main objectives of the survey were to measure satisfaction with the quality of service received, determine rider appreciation with the various service aspects and monitor the progress of results.
This survey is part of a continuous process that the STO has been conducting every year since 2008
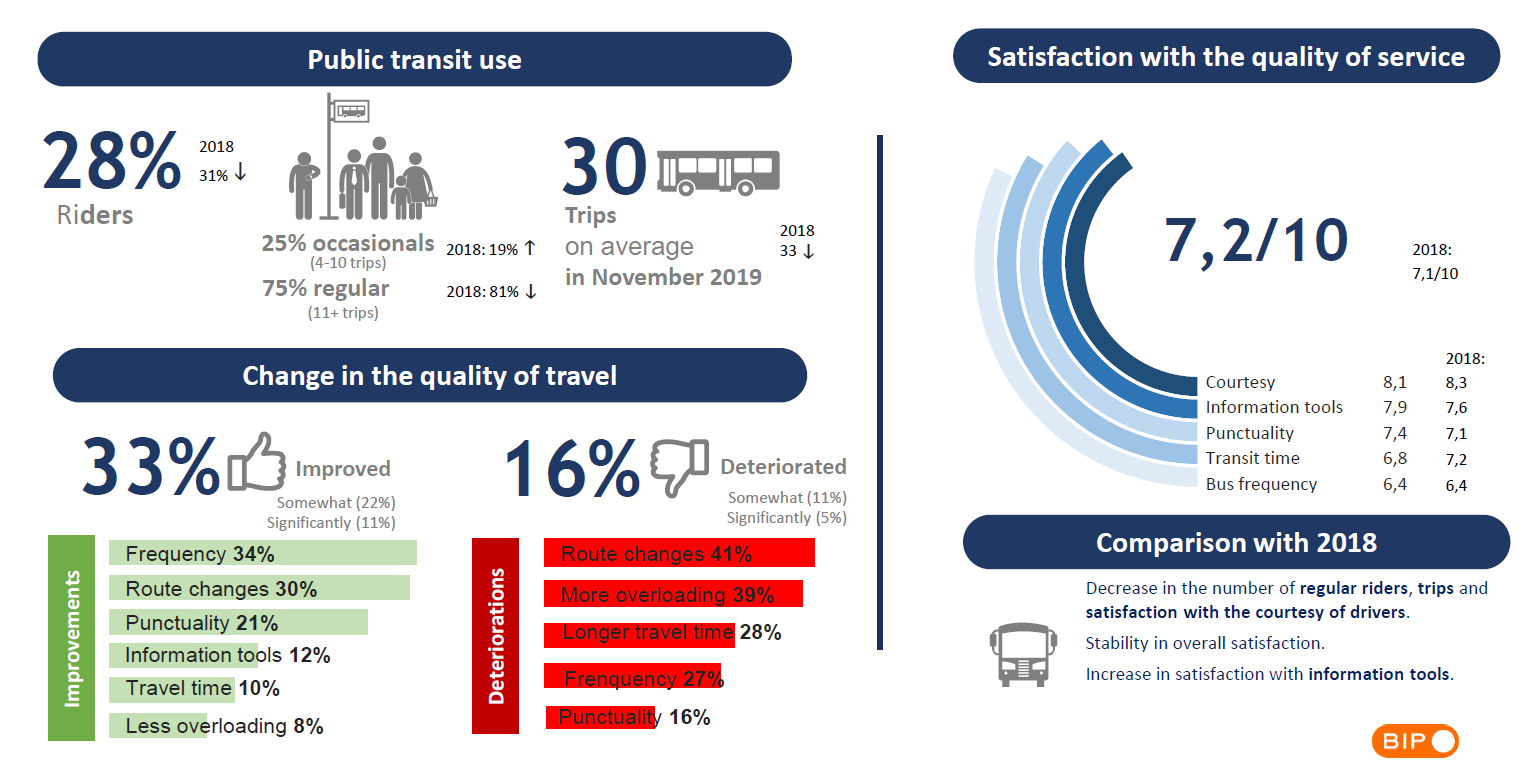
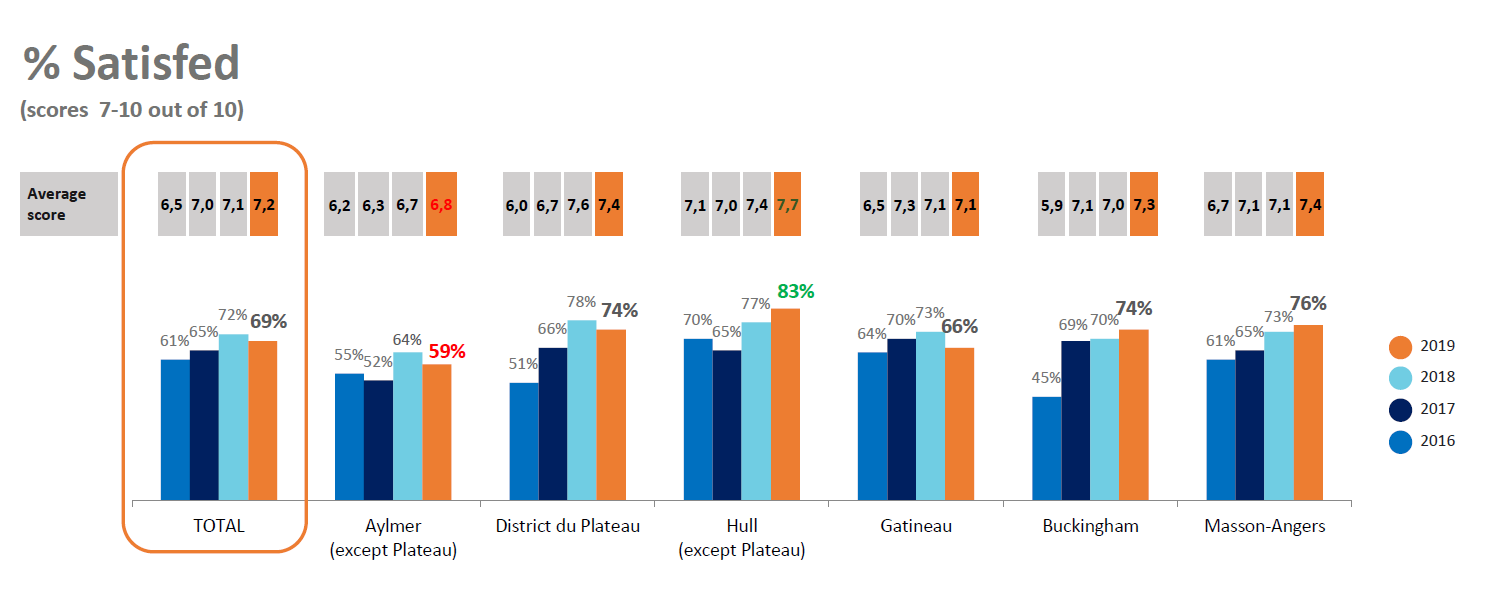
Satisfaction with the quality of service offered
The overall satisfaction with the quality of service offered by the STO is stable. The satisfaction is higer in Hull (except Plateau).
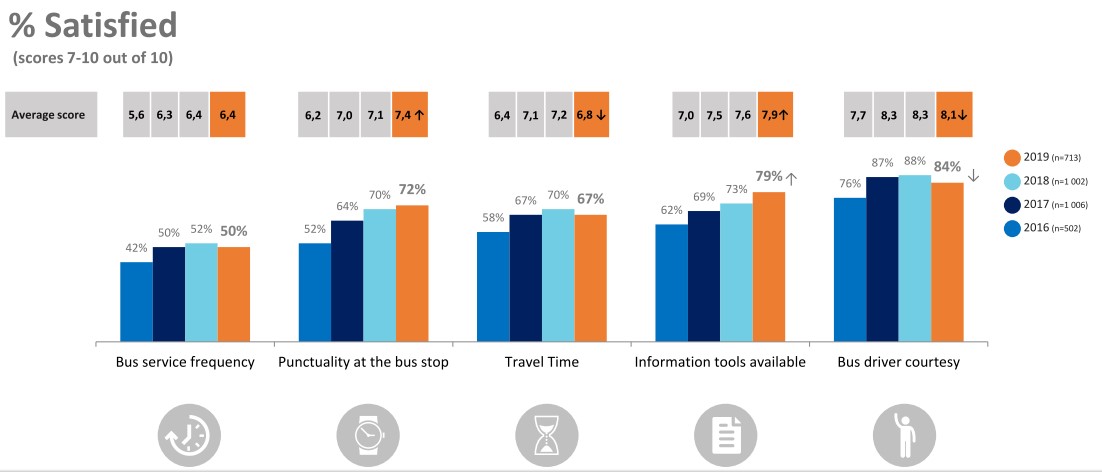
Satisfaction with service features
Satisfaction with the measurement tools and punctuality has been steadily rising over the past four years. Satisfaction with the bus service frequency has remained steady, whereas satisfaction with travel time has decreased somewhat.
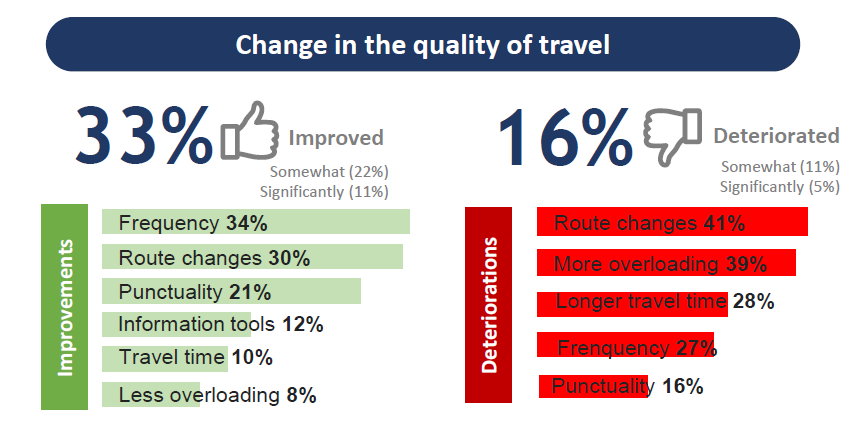
Change in the quality of travel
Half of riders (45%) feel that the service provided is similar to last year. One third think the quality has improved (33%), which is twice as many as those who felt it deteriorated (16%).
A greater number of riders in Hull, du Plateau sector, and occasional riders felt the service improved over last year.
Methodology
The satisfaction survey about the services provided by the Société de transport de l'Outaouais (STO) was conducted by BIP Recherche among Gatineau residents aged 18 and over, who made at least four trips on the STO system in November 2019.
This survey is part of a continuous satisfaction assessment that the STO has been conducting since 2008. The purpose is to measure rider perception of the services offered by the STO throughout the entire system.
The 10-point satisfaction scales can be interpreted as follows:
- Scores between 7 and 10: Satisfactory
- Scores between 5 and 6.9: Moderately satisfactory
- Scores between 1 and 4.9: Unsatisfactory
Notes
In order to identify the variances between the sub-groups in the survey, significantly higher proportions are shown in green in the tables, while significantly lower proportions are shown in red.
When applicable, comparisons with the results of the 2018 survey have been made. The up arrow indicates a score that is statistically higher than the results of the previous survey, whereas the down arrow indicates a score that is statistically lower.
Reference documents
- Results (In French only)
- Research report (In French only)
- Press Release (In French only)