
Satisfaction Survey about STO Services (2018)
Carried out in 2018, the main objectives of the survey were to measure satisfaction with the quality of service received, determine rider appreciation with the various service aspects and monitor the progress of results.
This survey is part of a continuous process that the STO has been conducting every year since 2008
Highlights
Satisfaction with the quality of service offered
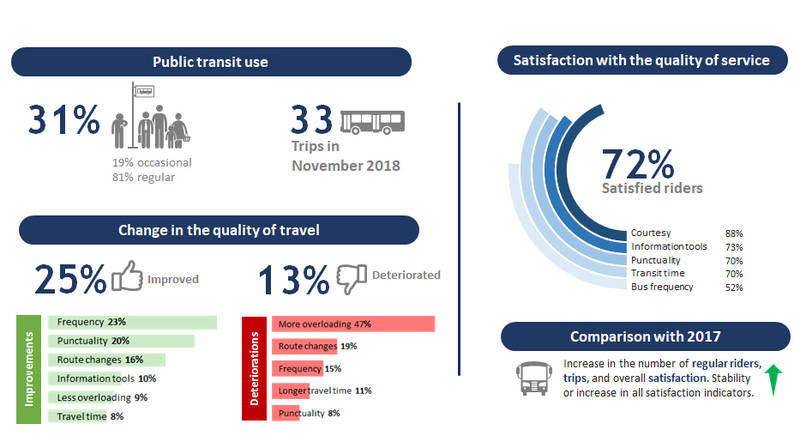
The overall satisfaction with the quality of service offered by the STO is higher than in 2017. An increase was observed in Aylmer (except Plateau), the Plateau area and Hull (except Plateau).

Satisfaction with service aspects
Satisfaction with punctuality at the bus stop and the information tools available rose this year.

Change in the quality of travel
Half of riders (53%) feel that the service provided is similar to last year. One quarter think the quality has improved (25%), which is twice as many as those who felt it deteriorated (13%).
A greater number of riders in Hull (except Plateau) felt the service improved over last year, whereas more riders in Aylmer (except Plateau) thought it deteriorated.

Concrete actions to improve rider experience
- Service improvements throughout the area
- Introduction of preferential measures:
- Traffic light priority
- Gradual improvement in punctuality through more detailed knowledge of the system (operational support and rider information system)
- Greater availability of real-time information, namely through:
- The Transit app and open data
- The Infobus service by phone, text message and m.sto.ca
- The installation of variable message signs (VMS) at dozens of locations in the system.
Methodology
The satisfaction survey about the services provided by the Société de transport de l'Outaouais (STO) was conducted by BIP Recherche among Gatineau residents aged 18 and over, who made at least four trips on the STO system in November 2018.
This survey is part of a continuous satisfaction assessment that the STO has been conducting since 2008. The purpose is to measure rider perception of the services offered by the STO throughout the entire system.
The 10-point satisfaction scales can be interpreted as follows:
- Scores between 7 and 10: Satisfactory
- Scores between 5 and 6.9: Moderately satisfactory
- Scores between 1 and 4.9: Unsatisfactory
Notes
In order to identify the variances between the sub-groups in the survey, significantly higher proportions are shown in red in the tables, while significantly lower proportions are shown in blue.
When applicable, comparisons with the results of the 2017 survey have been made. The up arrow indicates a score that is statistically higher than the results of the previous survey, whereas the down arrow indicates a score that is statistically lower.
Reference documents
- Research report (In French only)
- Results (In French only)
- Press Release (In French only)